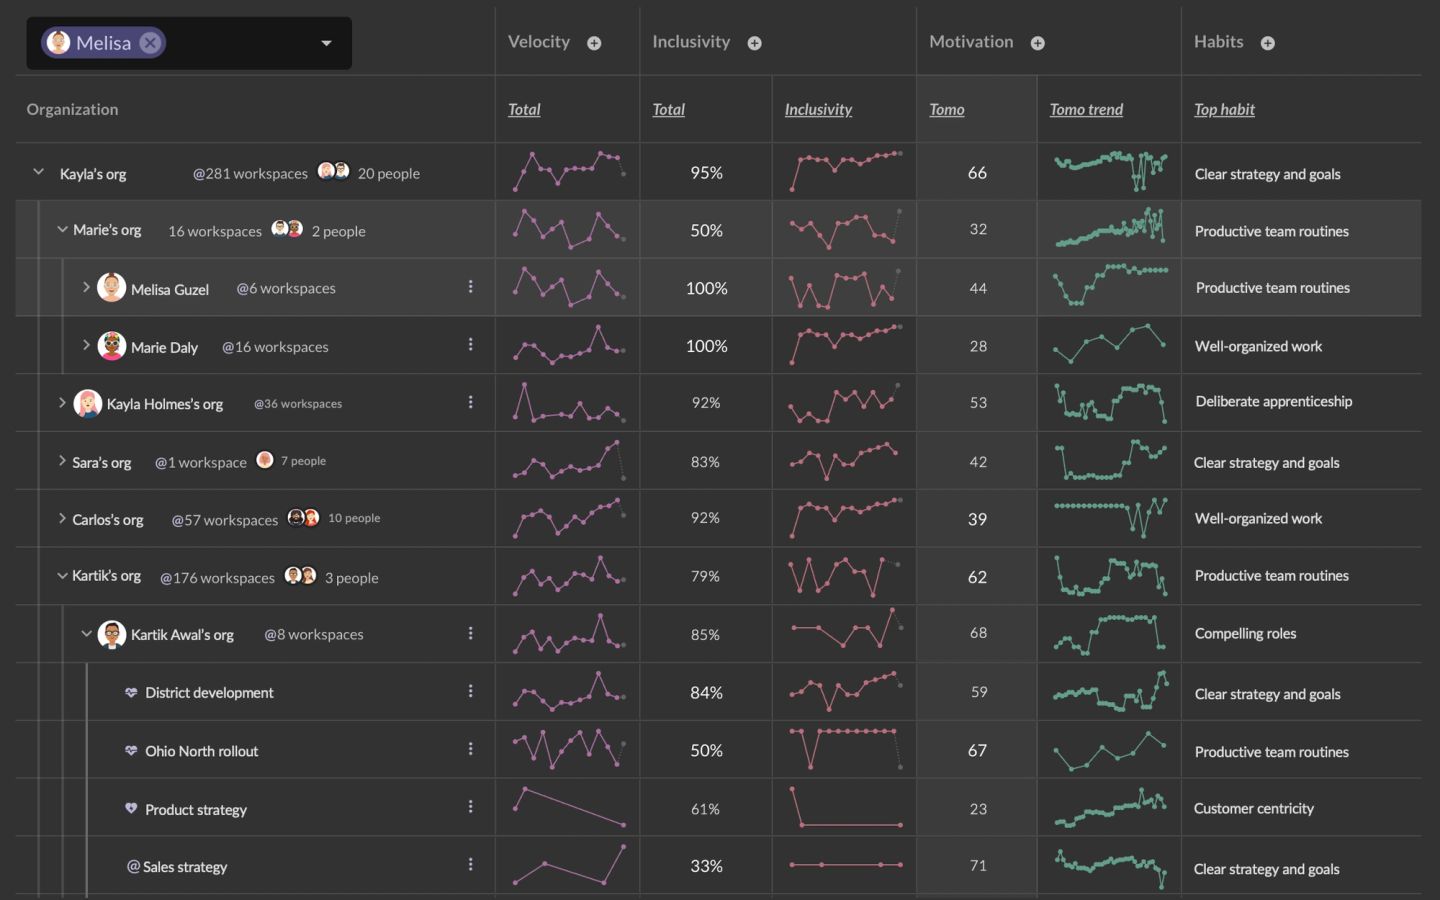
In Factor, the Analytics app automatically measures the core inputs of high performance in your organization. Those metrics are:
- Velocity - how quickly are we making progress?
- Inclusion - how many people are contributing their point of view?
- Motivation (i.e., "Total motivation" or "Tomo") - how are people feeling about their work?
- Habits - what routines and capabilities are teams prioritizing in order to improve their work?
These are the four metrics that high-performing teams use to ensure that they are balancing tactical and adaptive performance and sustaining their motivation for the long haul.
The Analytics app allows you to view these metrics for three main constructs:
- Orgs (aka "reporting lines")
- Teams (aka "workspaces")
- Individuals
For example, the below screenshots from Factor Analytics shows metrics for Kayla's entire organization. In this example, Kayla is the CEO, so all the metrics for every reporting line, workspace, and, ultimately, individual rolls up to and is nester under her row, "Kayla's org".

Note: Factor will display an individual's metrics for velocity and inclusion, but it will NEVER display and individual's metrics for motivation or habits.